SAS Graphics
29.6.07
27.6.07
mySQL with SAS
Using MySQL came out handy for us while designing databases for Clinical Trials where in the scalability is not much of an issue. The performance turns poor when a large number of users are simultaneously accessing the database. We are yet to do some benchmarking on a database with around 24 standard CDISC tables, where data will be entered for close to 200 patients.
Here is the small and handy piece of sas code to extract data off of a mySQL database to SAS
/*Importing datasets from SQL to SAS*/
libname sqllibrary ODBC datasrc='DBDRIVER' user=root password=root schema="testdb";
proc copy out=workdb in=testdb;
exclude validation schema_info;
run;
You will need to install the ODBC driver for MySQL before you venture into running this code
Labels:
clinical trials,
data management,
Kreara,
mySQL,
ODBC,
SAS
Hypothesis testing
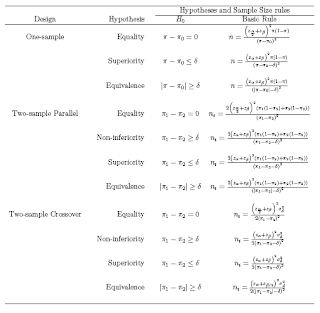
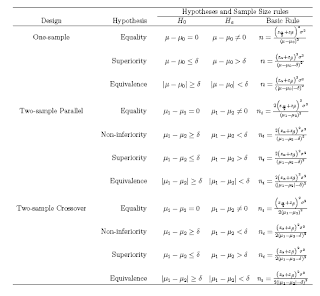
In studies concerned with detecting an effect (e.g. a difference between two treatments, or relative risk of a diagnosis if a certain risk factor is present versus absent), sample size calculations are important to ensure that if an effect deemed to be clinically meaningful exists,then there is a high chance of it being detected, i.e. that the analysis will be statistically significant. If the sample is too small, then even if large differences are observed, it will be impossible to show that these are due to anything more than sampling variation. There are different types of hypothesis testing problems depending on the goal of the research.
Let μS = mean of standard treatment, μT = mean of new treatment, and δ = the minimum clinically important difference.
Let μS = mean of standard treatment, μT = mean of new treatment, and δ = the minimum clinically important difference.
1. Test for Equality: Here the goal is to detect a clinically meaningful difference/effects is such a difference/effects exists
2. Test for Non-inferiority: To demonstrate that the new drug is as less effective as the standard treatment (ie the difference between the new treatment and the standard is less than the smallest clinically meaningful difference)
3. Test for Superiority: To demonstrate that the new treatment is more superior that standard treatment (ie the difference between the new treatment and the standard is greater than the smallest clinically meaningful difference).
4. Test for equivalence: To demonstrate the difference between the new treatment and standard treatment has no clinical importance

 It is important to note that
the test for superiority is often referred to as the test for clinical superiority
If δ = 0, it is called the test of statistical superiority
Equivalence is taken to be the alternative hypothesis, and the null hypothesis is nonequivalence
2. Test for Non-inferiority: To demonstrate that the new drug is as less effective as the standard treatment (ie the difference between the new treatment and the standard is less than the smallest clinically meaningful difference)
3. Test for Superiority: To demonstrate that the new treatment is more superior that standard treatment (ie the difference between the new treatment and the standard is greater than the smallest clinically meaningful difference).
4. Test for equivalence: To demonstrate the difference between the new treatment and standard treatment has no clinical importance

 It is important to note that
the test for superiority is often referred to as the test for clinical superiority
If δ = 0, it is called the test of statistical superiority
Equivalence is taken to be the alternative hypothesis, and the null hypothesis is nonequivalence
26.6.07
Hypothesis
Many statistical analyses involve the comparison of two treatments, procedures or subgroups of subjects. The numerical value summarizing the difference of interest is called the effect.
In other study designs the effect may be
a. Odds ratio (OR): H0 : OR=1
b. Relative risk (RR): H0 : RR=1
c. Risk Difference (RD): H0 : RD=0
d. Difference between means:H0 : Difference = 0
e. Correlation Coefficient : H0 : CC=0
Note that usually, the null hypothesis H0 states that there is no effect and the alternative hypothesis that there is an effect.
Subscribe to:
Comments (Atom)


