Kreara - Location

Showing posts with label clinical trials. Show all posts
Showing posts with label clinical trials. Show all posts
25.9.08


Ethical Guidelines for Clinical Research - India and the World
24.9.08
11.10.07
Wilcoxon Signed Rank test
As part of the efficacy analysis of a recent Phase III study , it was planned to determine the significant difference in efficacy of treatments over the weeks. Each treatment group was analyzed separately. The paired t-test was employed to carry out the analysis on the parametric data.
proc univariate data= eff_data;
var diff;
run;
ods output close;
The output will contain p-value corresponding to Student’s t, Sign and Signed Rank tests. The p-value corresponding to the signed rank test will be considered. Further, For a 1-sided p-value, we would divide the 2-sided p-value by 2.
25.7.07
Asthma Studies
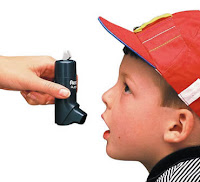 For the analysis of any clinical trial on asthma inhalers, your efficacy parameters are most probably going to be related to the spirometry measures and will almost always include the following
FEV1 - Forced expiratory volume in 1 second The FEV1 is the volume exhaled during the first second of a forced expiratory maneuver started from the level of total lung capacity.
PEF - Peak expiratory flow Expiratory peak flow (PEF) is the maximum flow generated during expiration performed with maximal force and started after a full inspiration .
FVC - Forced expiratory vital capacity The volume change of the lung between a full inspiration to total lung capacity and a maximal expiration to residual volume. Here are more details on Spirometry. Also check out GINA for more Asthma information
 For the analysis of any clinical trial on asthma inhalers, your efficacy parameters are most probably going to be related to the spirometry measures and will almost always include the following
FEV1 - Forced expiratory volume in 1 second The FEV1 is the volume exhaled during the first second of a forced expiratory maneuver started from the level of total lung capacity.
PEF - Peak expiratory flow Expiratory peak flow (PEF) is the maximum flow generated during expiration performed with maximal force and started after a full inspiration .
FVC - Forced expiratory vital capacity The volume change of the lung between a full inspiration to total lung capacity and a maximal expiration to residual volume. Here are more details on Spirometry. Also check out GINA for more Asthma information
Blind Review
First of all the ICH definition - Blind Review is the checking and assessment of data during the period of time between trial completion (the last observation on the last subject) and the breaking of the blind, for the purpose of finalizing the planned analysis.

So how do we do it ? We look at the Clinical Protocol and create a Blind Review Criteria document which will list out all the conditions that needs to be checked against the data to make sure that there is no violations. For eg. if Visit 1 were to happen with in 15-20 days of the screening visit, then we compare the dates of screening and visit1 and if the difference falls below 15 and above 20, then boom we have a violation. Then we write a SAS program to check all those conditions and run it to create a protocol violation document.
Easily said. But to do it and to make sure that all the violations are caught is one hell of a task Johnny.

So how do we do it ? We look at the Clinical Protocol and create a Blind Review Criteria document which will list out all the conditions that needs to be checked against the data to make sure that there is no violations. For eg. if Visit 1 were to happen with in 15-20 days of the screening visit, then we compare the dates of screening and visit1 and if the difference falls below 15 and above 20, then boom we have a violation. Then we write a SAS program to check all those conditions and run it to create a protocol violation document.
Easily said. But to do it and to make sure that all the violations are caught is one hell of a task Johnny.
4.7.07
Area Under Curve (AUC)
 In the field of pharmacokinetics, the area under the curve (AUC) is the area under the curve in a plot of concentration of drug in plasma against time.
In real-world terms the AUC (from zero to infinity) represents the total amount of drug absorbed by the body, irrespective of the rate of absorption. This is useful when trying to determine whether two formulations of the same dose (for example a capsule and a tablet) release the same dose of drug to the body.
AUC becomes useful for knowing the average concentration over a time interval, AUC/t. Also, AUC is referenced when talking about elimination.
The amount eliminated by the body = clearance (volume/time) * AUC (mass*time/volume).
Another application that we recently found is when we try to establish the equivalence of two asthma formulations and their superiority over placebo. Here are some links if you
a. want to learn how we can use integration to find the AUC
b. A small SAS macro to calculate AUC using trapezoidal rule
c. Use proc expand to find out the AUC
 In the field of pharmacokinetics, the area under the curve (AUC) is the area under the curve in a plot of concentration of drug in plasma against time.
In real-world terms the AUC (from zero to infinity) represents the total amount of drug absorbed by the body, irrespective of the rate of absorption. This is useful when trying to determine whether two formulations of the same dose (for example a capsule and a tablet) release the same dose of drug to the body.
AUC becomes useful for knowing the average concentration over a time interval, AUC/t. Also, AUC is referenced when talking about elimination.
The amount eliminated by the body = clearance (volume/time) * AUC (mass*time/volume).
Another application that we recently found is when we try to establish the equivalence of two asthma formulations and their superiority over placebo. Here are some links if you
a. want to learn how we can use integration to find the AUC
b. A small SAS macro to calculate AUC using trapezoidal rule
c. Use proc expand to find out the AUC
27.6.07
mySQL with SAS
Using MySQL came out handy for us while designing databases for Clinical Trials where in the scalability is not much of an issue. The performance turns poor when a large number of users are simultaneously accessing the database. We are yet to do some benchmarking on a database with around 24 standard CDISC tables, where data will be entered for close to 200 patients.
Here is the small and handy piece of sas code to extract data off of a mySQL database to SAS
/*Importing datasets from SQL to SAS*/
libname sqllibrary ODBC datasrc='DBDRIVER' user=root password=root schema="testdb";
proc copy out=workdb in=testdb;
exclude validation schema_info;
run;
You will need to install the ODBC driver for MySQL before you venture into running this code
Here is the small and handy piece of sas code to extract data off of a mySQL database to SAS
/*Importing datasets from SQL to SAS*/
libname sqllibrary ODBC datasrc='DBDRIVER' user=root password=root schema="testdb";
proc copy out=workdb in=testdb;
exclude validation schema_info;
run;
You will need to install the ODBC driver for MySQL before you venture into running this code
Hypothesis testing
In studies concerned with detecting an effect (e.g. a difference between two treatments, or relative risk of a diagnosis if a certain risk factor is present versus absent), sample size calculations are important to ensure that if an effect deemed to be clinically meaningful exists,then there is a high chance of it being detected, i.e. that the analysis will be statistically significant. If the sample is too small, then even if large differences are observed, it will be impossible to show that these are due to anything more than sampling variation. There are different types of hypothesis testing problems depending on the goal of the research.
Let μS = mean of standard treatment, μT = mean of new treatment, and δ = the minimum clinically important difference.
Let μS = mean of standard treatment, μT = mean of new treatment, and δ = the minimum clinically important difference.
1. Test for Equality: Here the goal is to detect a clinically meaningful difference/effects is such a difference/effects exists
2. Test for Non-inferiority: To demonstrate that the new drug is as less effective as the standard treatment (ie the difference between the new treatment and the standard is less than the smallest clinically meaningful difference)
3. Test for Superiority: To demonstrate that the new treatment is more superior that standard treatment (ie the difference between the new treatment and the standard is greater than the smallest clinically meaningful difference).
4. Test for equivalence: To demonstrate the difference between the new treatment and standard treatment has no clinical importance

 It is important to note that
the test for superiority is often referred to as the test for clinical superiority
If δ = 0, it is called the test of statistical superiority
Equivalence is taken to be the alternative hypothesis, and the null hypothesis is nonequivalence
2. Test for Non-inferiority: To demonstrate that the new drug is as less effective as the standard treatment (ie the difference between the new treatment and the standard is less than the smallest clinically meaningful difference)
3. Test for Superiority: To demonstrate that the new treatment is more superior that standard treatment (ie the difference between the new treatment and the standard is greater than the smallest clinically meaningful difference).
4. Test for equivalence: To demonstrate the difference between the new treatment and standard treatment has no clinical importance
 It is important to note that
the test for superiority is often referred to as the test for clinical superiority
If δ = 0, it is called the test of statistical superiority
Equivalence is taken to be the alternative hypothesis, and the null hypothesis is nonequivalence
Subscribe to:
Posts (Atom)