25.7.07

Asthma Studies

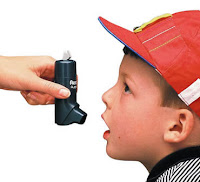
For the analysis of any clinical trial on asthma inhalers, your efficacy parameters are most probably going to be related to the spirometry measures and will almost always include the following
FEV1 - Forced expiratory volume in 1 second
The FEV1 is the volume exhaled during the first second of a forced expiratory maneuver started from the level of total lung capacity.

PEF - Peak expiratory flow
Expiratory peak flow (PEF) is the maximum flow generated during expiration performed with maximal force and started after a full inspiration .

FVC - Forced expiratory vital capacity
The volume change of the lung between a full inspiration to total lung capacity and a maximal expiration to residual volume. Here are more details on Spirometry. Also check out GINA for more Asthma information

Blind Review

First of all the ICH definition - Blind Review is the checking and assessment of data during the period of time between trial completion (the last observation on the last subject) and the breaking of the blind, for the purpose of finalizing the planned analysis.


So how do we do it ? We look at the Clinical Protocol and create a Blind Review Criteria document which will list out all the conditions that needs to be checked against the data to make sure that there is no violations. For eg. if Visit 1 were to happen with in 15-20 days of the screening visit, then we compare the dates of screening and visit1 and if the difference falls below 15 and above 20, then boom we have a violation. Then we write a SAS program to check all those conditions and run it to create a protocol violation document.

Easily said. But to do it and to make sure that all the violations are caught is one hell of a task Johnny.
Hodges-Lehmann ∆

A parametric test, such as the t-test, compares the means of the two samples. A nonparametric method, such as the Wilcoxon Rank Sum Test compares the entire distributions of the two independent samples. The null hypothesis of the Wilcoxon Rank Sum test says the two samples can be viewed as a single sample from one population. The alternative hypothesis is that the first treatment group has a different different distribution (or location) than the second treatment group.

The treatment effect, denoted as ∆, is the difference between treatment groups. If parametric methods were used, means could be calculated for each treatment group, and a subtraction of the means can be used to estimate ∆. However, when the data are not normally distributed and the median value of the response variable of interest is calculated for each treatment group, the estimate of the difference in treatment groups is not as straightforward as subtracting one median from the other.

The difference in medians is estimated using the methodology of Hodges-Lehmann. It is a very simple approach. The following steps can be used to estimate ∆:

• form all possible differences between the first treatment group and the second treatment group, in the response variable of interest. For example, if there are 100 patients in each group then 10,000 (100*100) differences would be calculated.
• the estimator ∆ is the median of those 10,000 differences.

All this taken from this SUPER PAPER.
LOCF

In clinical trials, data are often collected over a period of time from participating patients. In many situations, however, analyses are only based on data from the last time point (the end of the study) or change from the baseline to the last time point. It is often the case that patients drop out before the completion of the study.

So the question arises on how to perform analysis of the last observations, which are defined as observations from the last time point for patients who completed the study and the last observations prior to the dropout for patients who did not complete the study.

An analysis based only on data from patients who completed the study is called a completers analysis. Although a completers analysis is sufficient in some situations, it is often more desirable to perform an all randomized subjects analysis.

The analysis based on all randomized subjects is usually referred to as an intention-to-treat (ITT) analysis. Regulatory agencies generally consider the ITT analysis as the primary analysis for evaluation of efficacy and safety in clinical trials with informative dropout.

When the dropout is informative, the target populations of a completers analysis and an ITT analysis are different. Suppose that the population of patients under certain treatment is stratified according to the time of the last observations; then the target population of a completers analysis is only the subpopulation of patients who completed the study under different treatments while the target populations of an ITT analysis include all the subpopulations under different treatments.

For the last observation carry-forward (LOCF) analysis based on ITT population, the last observations are carried forward to the last time point for patients who dropped out. The LOCF analysis treats the carried-forward data as observed data at the last time point. Therefore when the dropout is informative, the LOCF analysis may introduce biases to the statistical inference, which has been speculated upon by the Food and Drug Administration (FDA) it is still unknown whether or not the LOCF test is asymptotically correct

Here is a macro that might help you with LOCF

24.7.07

Research Capital

An analysis of published papers in the field of medical research has found that Thiruvananthapuram accounts for 64 percent of the total papers published in the state. Something that make Kreara proud about our location

19.7.07

Concomitant Medications

Did you know we could code them with out paying 7 lakhs to Uppsala.
Check this out

4.7.07

Area Under Curve (AUC)

In the field of pharmacokinetics, the area under the curve (AUC) is the area under the curve in a plot of concentration of drug in plasma against time.

In real-world terms the AUC (from zero to infinity) represents the total amount of drug absorbed by the body, irrespective of the rate of absorption. This is useful when trying to determine whether two formulations of the same dose (for example a capsule and a tablet) release the same dose of drug to the body.


AUC becomes useful for knowing the average concentration over a time interval, AUC/t. Also, AUC is referenced when talking about elimination.
The amount eliminated by the body = clearance (volume/time) * AUC (mass*time/volume).

Another application that we recently found is when we try to establish the equivalence of two asthma formulations and their superiority over placebo. Here are some links if you

a. want to learn how we can use integration to find the AUC
b. A small SAS macro to calculate AUC using trapezoidal rule
c. Use proc expand to find out the AUC


2.7.07

Wilcoxon rank-sum test

The Wilcoxon rank-sum test is a non-parametric analog of the two-sample t-test. It is based on ranks of the data, and is used to compare location parameters, such as the mean or median, between two independent populations without the assumption of normally distributed data.


DATA RNKSM;
INPUT TRT $ PAT SCORE @@;
DATALINES;
SER 2 0 SER 3 2 SER 5 3 SER 6 3
SER 8 -2 SER 10 1 SER 12 3 SER 14 3
SER 16 -1 SER 17 2 SER 20 -3 SER 21 3
SER 22 3 SER 24 0 SER 26 2 SER 27 -1
PBO 1 3 PBO 4 -1 PBO 7 2 PBO 9 3
PBO 11 -2 PBO 13 1 PBO 15 0 PBO 18 -1
PBO 19 -3 PBO 23 -2 PBO 25 1 PBO 28 0
;

PROC NPAR1WAY WILCOXON DATA = RNKSM;
CLASS TRT; VAR SCORE;
TITLE1 'The Wilcoxon Rank-Sum Test';
RUN;

1.7.07

Van Elteren's test

You can think of van Elteren's test as analogous to an analysis of variance with a blocking factor. One common use of the van Elteren test is with clinic as the stratification variable in a multicenter clinical study. van Elteren's test is used in lieu of randomized blocks ANOVA with clinics as blocks. In the case of a geographically distributed study we could use this test with country as a blocking factor

Here is how we could perform the test in SAS

data a;
input blocks treatmnt consump @@;
datalines;
1 1 236 1 2 255
2 1 183 2 2 179 2 2 193
3 1 115 3 1 128 3 2 132
4 1 61 4 1 70 4 1 79 4 2 67 4 2 84 4 2 88
;

proc freq;
tables blocks * treatmnt * consump / cmh2 scores=modridit noprint;
run;