Showing posts with label Kreara. Show all posts

21.6.21

Overview

KREARA Solutions is a clinical data management and biometrics solution provider based out of the beautiful campus of Technopark, Trivandrum. Originally established as a statistical services vendor in April 2004, Kreara soon gained traction in the field of clinical trials and got ourselves well versed with the ICH/GCP and CFR PART 11 regulatory requirements. Since then Kreara has been using custom built software applications and standard statistical packages like SAS for providing end-to-end data management and biometric solutions to the pharmaceutical companies and contract research organizations in India, USA and Europe. Kreara was officially incorporated in April 2004.

Our mission is to become the Number 1 CRO in the country providing supplementary services for clinical trials and ultimately help our clients to make affordable and quality health care to the masses a reality.

10.10.08

Scrum - Agile project management


Scrum is a process skeleton that includes a set of practices and predefined roles. The main roles in Scrum are the ScrumMaster who maintains the processes and works similar to a project manager, the Product Owner who represents the stakeholders, and the Team which includes the developers.
During each sprint, a 15-30 day period (length decided by the team), the team creates an increment of potential shippable (usable) software. The set of features that go into each sprint come from the product backlog, which is a prioritized set of high level requirements of work to be done. Which backlog items go into the sprint is determined during the sprint planning meeting. During this meeting the Product Owner informs the team of the items in the product backlog that he wants completed. The team then determines how much of this they can commit to complete during the next sprint. During the sprint, no one is able to change the sprint backlog, which means that the requirements are frozen for a sprint.
There are several implementations of systems for managing the Scrum process which range from yellow stickers and white-boards to software packages. One of Scrum's biggest advantages is that it is very easy to learn and requires little effort to start using.

6.10.08

Maintaining document standards at Kreara
Prepared by Sreedevi Menon

Documentation is an integral part of clinical trial studies and maintenance of standards while preparing various documents is of utmost importance. The documents related to clinical trial study may be anything from SOPs to documents related to project management, data management, statistics or SAS.

At Kreara, all or some of such documents are prepared as per requirement of the study. The emphasis is not only to make these documents as informative as possible but also to convey the information in a concise and effective manner. Further, effort is taken to maintain the quality of the information contained and the way of presentation.

An SOP for General Documentation Guidelines is maintained at Kreara and all personnel in the organization are trained on the same. This standard operating procedure describes the various guidelines to be followed during preparation and amendment of SOPs in general. It also presents guidelines for preparation of project related documents like the naming conventions to be followed.

In addition to this, individual SOPs are maintained for each and every document and to maintain standards, templates with instructions regarding the contents, layout and formatting of the contents are maintained in a central repository. The personnel responsible for writing the documents are required to follow the format in the templates while preparing the documents. The QC personnel check for any non-compliance to templates in the document in addition to the relevance of contents. Further the QA manager is responsible to ensure that the process is followed correctly.

The personnel at Kreara are trained in the SOPs related to document writing. A great deal of exposure in the related field is provided to them so that they are capable of preparing informative and effective documents.

25.9.08

Kreara - Location
Technopark
View SlideShare presentation or Upload your own. (tags: kreara location)
Ethical Guidelines for Clinical Research - India and the World

24.9.08

Kreara - Clinical Data management and Biomterics

21.9.08

Odds ratio
Prepared by Prajitha Nair & Sreeja E V

In order to quantify the association between the exposure and the outcome of interest the incidence of disease in a group of individuals exposed to the supposed risk factor must be compared with the incidence in a group of persons not exposed. This comparison can be summarized by calculating either the ratio of the measures of disease occurrence for the two groups, which indicates the likelihood of developing the disease in the exposed individuals relative to those unexposed.In case-control studies, it is not possible to directly estimate disease incidence in those exposed and those unexposed, since people are selected on the basis of having or not having the condition of interest, not on the basis of their exposure status. It is however, possible to calculate the odds of exposure in the cases and in the controls.The odds ratio (OR) estimates the magnitude of association between the exposure and outcome. It is defined as the ratio of odds of an event occurring in one group to the odds of it occurring in another group, or to a sample-based estimate of that ratio. These groups might be an experimental group and control group.The 2x2 contingency table showing the relationship between the exposure and the disease is presented as follows:


Probability of being exposed among cases=a/(a+c)Probability of being non-exposed among cases=c/(a+c)Odds of being exposed among cases=a/cProbability of being exposed among controls=b/(b+d)Probability of being non-exposed among controls=d/(b+d)Odds of being exposed among controls=b/dOdds ratio = (odds of being exposed among cases)/ (odds of being exposed among controls)= (a/c)/ (b/d)= (a*d)/ (b*c)
In strict terms, the odds ratio obtained tells us how many more (or less, if the exposure is associated with a reduced risk) times likely the cases are to have been exposed to the factor under study compared with the controls.

If odds ratio is equal to 1 then this implies that the condition or event under study is equally likely in both groups. An odds ratio greater than 1 indicates that the condition or event is more likely in the first group. An odds ratio less than 1 indicate that the condition or event is less likely in the first group. The odds ratio can vary from zero to infinity.

Odds Ratio using SAS
Prepared by Prajitha Nair


In the case-control study, the risk of cervical cancer was examined in relation to a gene XXXX. The status of the genes is abnormal and normal wherein normal is considered as the referent category.

Consider an example:data gene;input cat $7. genstatus $4. count;cards;case abn 119control abn 68case nor 317control nor 319;run;

ods output RelativeRisks=relrisk(where=(studytype="Case-Control (Odds Ratio)"));proc freq data=gene ;tables cat*genstatus/relrisk ;weight count;run;ods output close;

The table will be as follows:

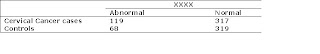
Odds of exposure among cases=119/317Odds of exposure among controls=68/319Odds ratio= odds of exposure among cases/odds of exposure among controls =1.76

The odds ratio with respect to XXXX shows that the odds of abnormal genotype occurring in case group is 1.76 times higher than it occurring in control group. The 95% confidence interval for the odds ratio is obtained as (1.26, 2.46).The cervical cancer cases were 76% more likely to have abnormal genes than controls. In short, the odds ratio indicates that women who have abnormal genes were 76% more likely to develop cervical cancer than those with normal genes.


4.9.08

Kreara - Preclinical research services


24.7.07

Research Capital

An analysis of published papers in the field of medical research has found that Thiruvananthapuram accounts for 64 percent of the total papers published in the state. Something that make Kreara proud about our location

27.6.07

mySQL with SAS

Using MySQL came out handy for us while designing databases for Clinical Trials where in the scalability is not much of an issue. The performance turns poor when a large number of users are simultaneously accessing the database. We are yet to do some benchmarking on a database with around 24 standard CDISC tables, where data will be entered for close to 200 patients.

Here is the small and handy piece of sas code to extract data off of a mySQL database to SAS

/*Importing datasets from SQL to SAS*/
libname sqllibrary ODBC datasrc='DBDRIVER' user=root password=root schema="testdb";
proc copy out=workdb in=testdb;
exclude validation schema_info;
run;

You will need to install the ODBC driver for MySQL before you venture into running this code

26.6.07

P value

The p-value is the probability of obtaining the effect as extreme or more extreme than what is observed in the study if the null hypothesis of no effect is actually true. It is usually expressed as a proportion (e.g. p=0.001).
Hypothesis

Many statistical analyses involve the comparison of two treatments, procedures or subgroups of subjects. The numerical value summarizing the difference of interest is called the effect.

In other study designs the effect may be
a. Odds ratio (OR): H0 : OR=1
b. Relative risk (RR): H0 : RR=1
c. Risk Difference (RD): H0 : RD=0
d. Difference between means:H0 : Difference = 0
e. Correlation Coefficient : H0 : CC=0

Note that usually, the null hypothesis H0 states that there is no effect and the alternative hypothesis that there is an effect.