Kreara - Location

25.9.08
Ethical Guidelines for Clinical Research - India and the World
24.9.08
21.9.08
Odds ratio

In order to quantify the association between the exposure and the outcome of interest the incidence of disease in a group of individuals exposed to the supposed risk factor must be compared with the incidence in a group of persons not exposed. This comparison can be summarized by calculating either the ratio of the measures of disease occurrence for the two groups, which indicates the likelihood of developing the disease in the exposed individuals relative to those unexposed.In case-control studies, it is not possible to directly estimate disease incidence in those exposed and those unexposed, since people are selected on the basis of having or not having the condition of interest, not on the basis of their exposure status. It is however, possible to calculate the odds of exposure in the cases and in the controls.The odds ratio (OR) estimates the magnitude of association between the exposure and outcome. It is defined as the ratio of odds of an event occurring in one group to the odds of it occurring in another group, or to a sample-based estimate of that ratio. These groups might be an experimental group and control group.The 2x2 contingency table showing the relationship between the exposure and the disease is presented as follows:
Probability of being exposed among cases=a/(a+c)Probability of being non-exposed among cases=c/(a+c)Odds of being exposed among cases=a/cProbability of being exposed among controls=b/(b+d)Probability of being non-exposed among controls=d/(b+d)Odds of being exposed among controls=b/dOdds ratio = (odds of being exposed among cases)/ (odds of being exposed among controls)= (a/c)/ (b/d)= (a*d)/ (b*c)
In strict terms, the odds ratio obtained tells us how many more (or less, if the exposure is associated with a reduced risk) times likely the cases are to have been exposed to the factor under study compared with the controls.
In strict terms, the odds ratio obtained tells us how many more (or less, if the exposure is associated with a reduced risk) times likely the cases are to have been exposed to the factor under study compared with the controls.
If odds ratio is equal to 1 then this implies that the condition or event under study is equally likely in both groups. An odds ratio greater than 1 indicates that the condition or event is more likely in the first group. An odds ratio less than 1 indicate that the condition or event is less likely in the first group. The odds ratio can vary from zero to infinity.
Odds Ratio using SAS
Prepared by Prajitha Nair
In the case-control study, the risk of cervical cancer was examined in relation to a gene XXXX. The status of the genes is abnormal and normal wherein normal is considered as the referent category.
Consider an example:data gene;input cat $7. genstatus $4. count;cards;case abn 119control abn 68case nor 317control nor 319;run;
ods output RelativeRisks=relrisk(where=(studytype="Case-Control (Odds Ratio)"));proc freq data=gene ;tables cat*genstatus/relrisk ;weight count;run;ods output close;
The table will be as follows:
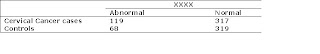 Odds of exposure among cases=119/317Odds of exposure among controls=68/319Odds ratio= odds of exposure among cases/odds of exposure among controls =1.76
The odds ratio with respect to XXXX shows that the odds of abnormal genotype occurring in case group is 1.76 times higher than it occurring in control group. The 95% confidence interval for the odds ratio is obtained as (1.26, 2.46).The cervical cancer cases were 76% more likely to have abnormal genes than controls. In short, the odds ratio indicates that women who have abnormal genes were 76% more likely to develop cervical cancer than those with normal genes.
19.9.08
Odds Ratio when cell count is zero
Prepared by Prajitha Nair
If frequency of the counts in any one of the cell is zero then the odds ratio cannot be computed?
Consider the example:
data gene;
input cat $7. genstatus $4. count;
cards;
case abn 119
control abn 0
case nor 317
control nor 319
;
run;
ods output RelativeRisks=relrisk(where=(studytype="Case-Control (Odds Ratio)"));
proc freq data=gene ;
tables cat*genstatus/relrisk ;
weight count;
run;
ods output close;
The output will look as follows:

This can be resolved as follows:
ods output CommonRelRisks=cmnrelrisk;
proc freq data=gene ;
tables cat*genstatus/relrisk cmh ;
weight count;
run;
ods output close;
The output will be produced as:

data cmnrelrisk_1(keep=Value LowerCL UpperCL);
set cmnrelrisk;
if studytype eq " (Odds Ratio)" then if method eq "Logit **" and value ne . then output;
else if studytype="Case-Control" then if method eq "Mantel-Haenszel" and value not in (.,0.0000) then output;
format LowerCL UpperCL ODDSR8.3 value ODDSR8.3;
run;
The cmh option will help to tackle the problem. The logit method will add 0.5 in all the cells of the 2 x 2 cross tabulation table where zero is in anyone of the cell and then odds ratio is evaluated.
Thus the odds ratio obtained is 240.506.
Prepared by Prajitha Nair
If frequency of the counts in any one of the cell is zero then the odds ratio cannot be computed?
Consider the example:
data gene;
input cat $7. genstatus $4. count;
cards;
case abn 119
control abn 0
case nor 317
control nor 319
;
run;
ods output RelativeRisks=relrisk(where=(studytype="Case-Control (Odds Ratio)"));
proc freq data=gene ;
tables cat*genstatus/relrisk ;
weight count;
run;
ods output close;
The output will look as follows:
This can be resolved as follows:
ods output CommonRelRisks=cmnrelrisk;
proc freq data=gene ;
tables cat*genstatus/relrisk cmh ;
weight count;
run;
ods output close;
The output will be produced as:
data cmnrelrisk_1(keep=Value LowerCL UpperCL);
set cmnrelrisk;
if studytype eq " (Odds Ratio)" then if method eq "Logit **" and value ne . then output;
else if studytype="Case-Control" then if method eq "Mantel-Haenszel" and value not in (.,0.0000) then output;
format LowerCL UpperCL ODDSR8.3 value ODDSR8.3;
run;
The cmh option will help to tackle the problem. The logit method will add 0.5 in all the cells of the 2 x 2 cross tabulation table where zero is in anyone of the cell and then odds ratio is evaluated.
Thus the odds ratio obtained is 240.506.
4.9.08
Kreara - Preclinical research services
Kreara - Preclinical research services
View SlideShare presentation or Upload your own.

Subscribe to:
Posts (Atom)